Outline
Introduction
Effective data analysis is crucial for drawing meaningful insights and making informed decisions. Reporting plays a crucial role in not just visualization, planning, control, and forecasting, but also in helping organizations achieve growth and profitability. FleetRunnr, a logistics management platform, offers a wide range of features that allow users to capture and analyze data, create custom dashboards and queries, providing valuable insights to make better decisions.
Reports and Custom Questions
FleetRunnr provides users with pre-set reports that assist in an overall successful delivery operation. These reports provide valuable real-time data on delivered orders, attempted orders, return orders, aging or late orders, lost/misplaced orders, accounting reports, delivery zone reports and much more.
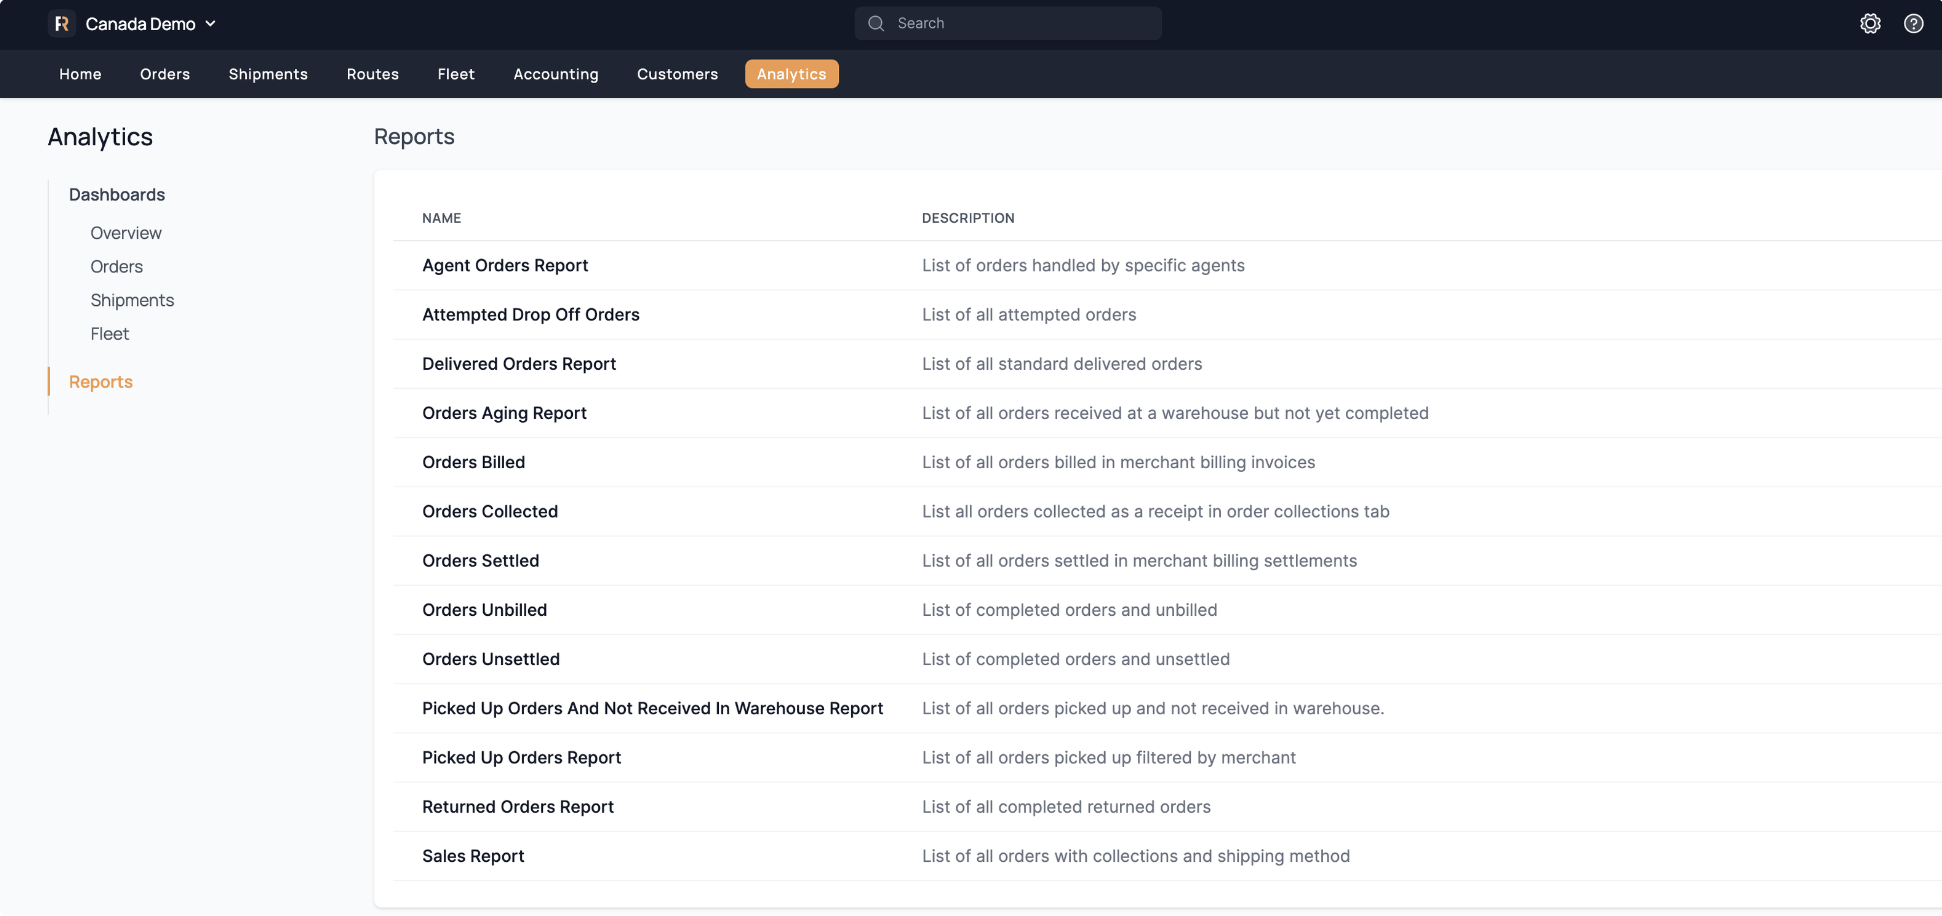
By clicking on any of the above reports, you will be able to first filter by the required fields such as Date ranges, and then download the results as either XLXS, CSV or JSON.
More importantly, FleetRunnr provides users with the flexibility and simplicity of creating any custom report, while also maintaining full control over visible columns, filters and visualization methods.
Analytics and Custom Dashboards
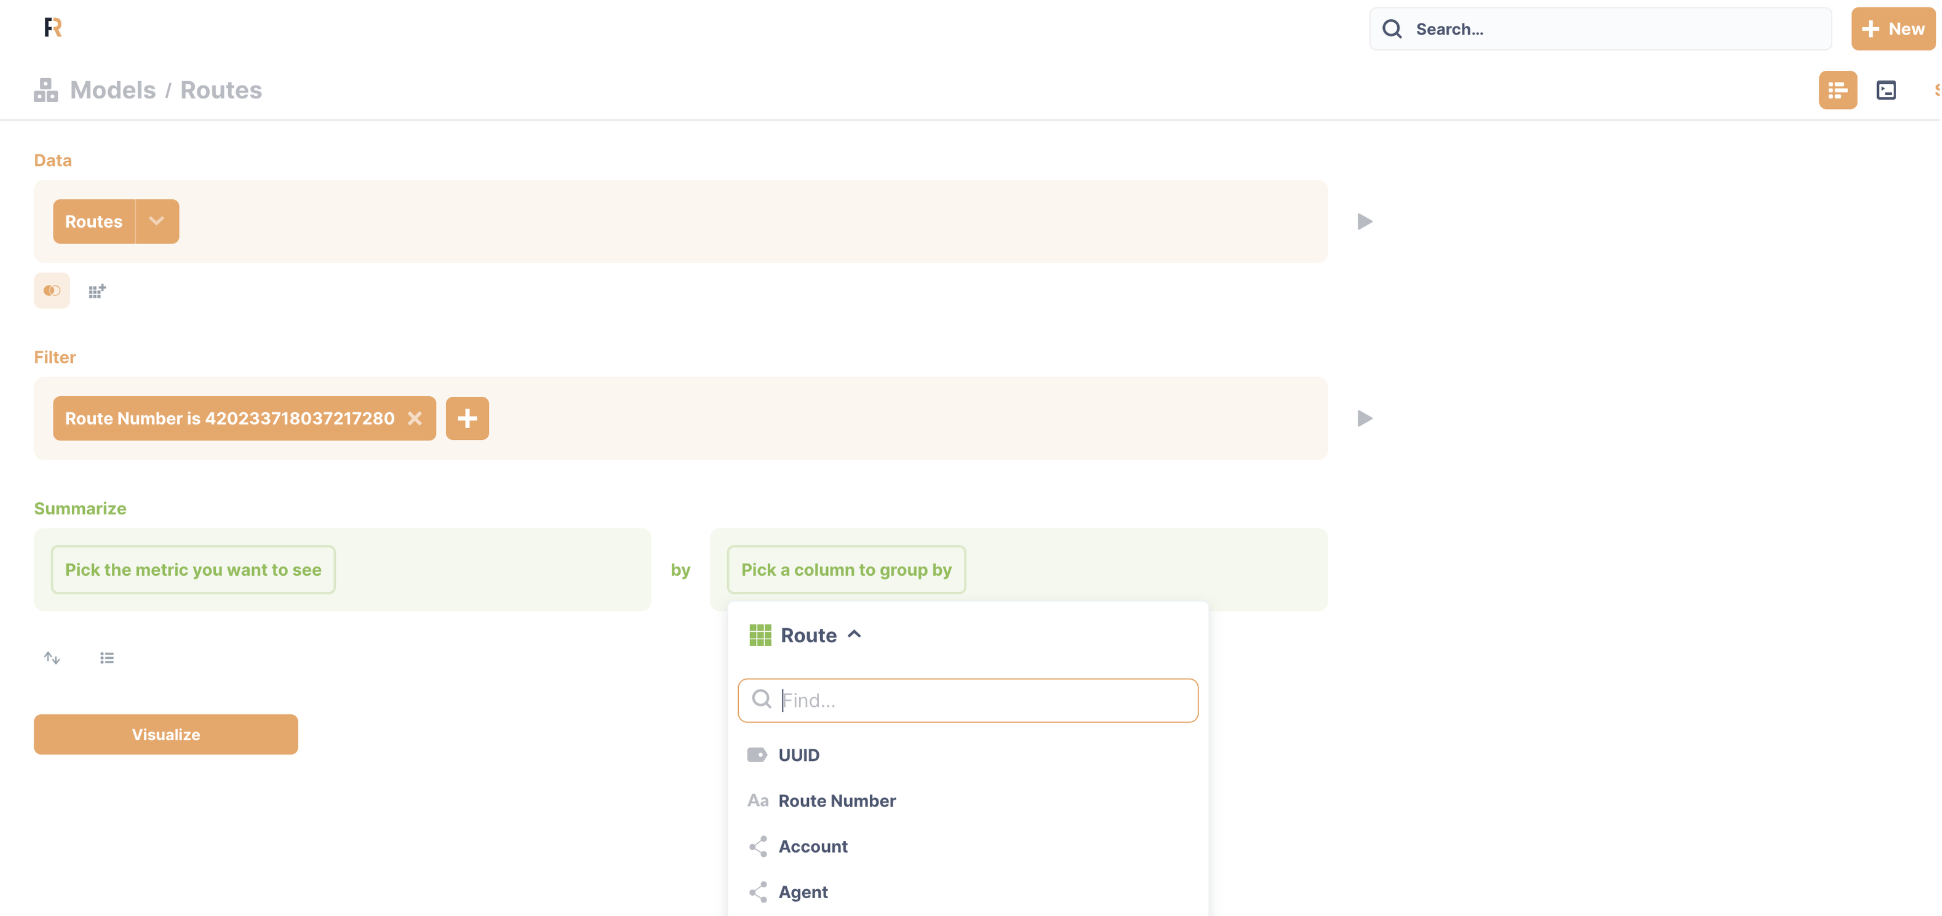
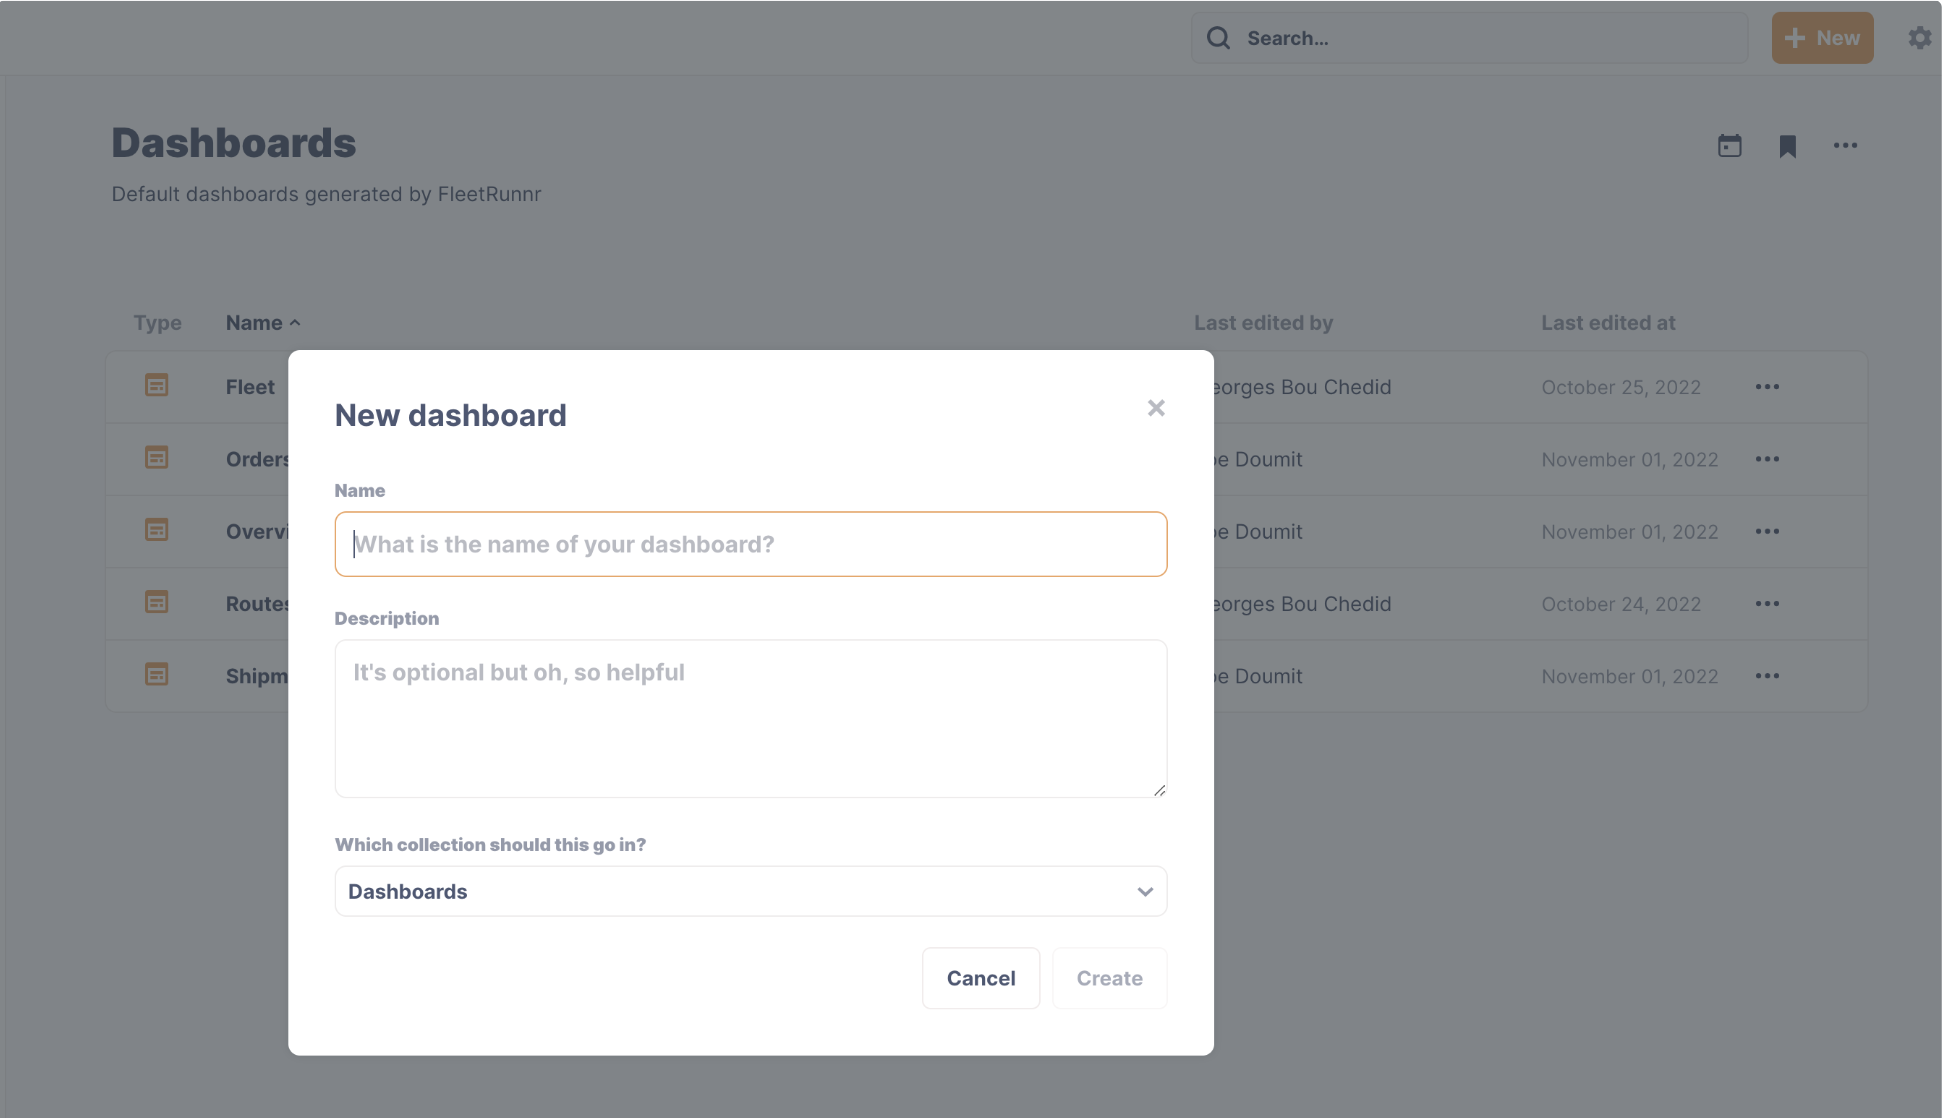
Analytics and dashboards allow users to make informed decisions based on live and historical data by providing visual representations such as bar graphs, pie charts, tables and line graphs, which help identify bottlenecks and operational issues. FleetRunnr, a platform for logistics management, offers pre-set dashboards for orders, shipments, routes and fleet, as well as the ability to create custom dashboards. The option to create unique widgets tailored to specific business needs can provide further insights.
The process of creating custom dashboards simple. Start off by building the analytic widgets, then add them to a newly created Dashboard.
Conclusion
In conclusion, being able to effectively collect and analyze data can be the key to a company's success. While pre-set reports and analytics can provide a useful starting point, the ability to create custom queries and dashboards enables a more tailored and specific approach, as no two companies operate exactly the same. Through setting key performance indicators, notifications and alerts, companies can proactively address issues and make better-informed decisions for forecasting and long-term planning, which in turn helps to stay on top of operational needs and complexities.

